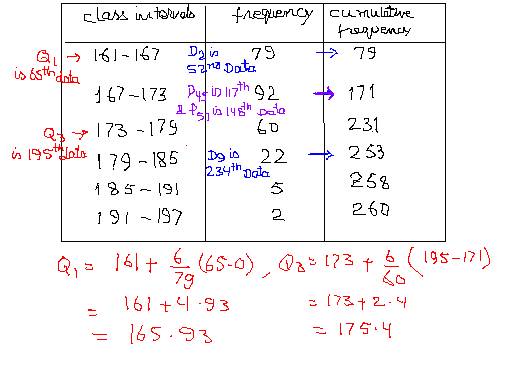
First let’s organize the given data in a tabular form as shown below. To calculate the first and the third quartile, determine the data representing these quartiles. Since the Total number of data is 260, the first quartile will be the 65 th value and the third quartile will be the 195th value. The 65th value would lie in the class interval 161-167 and the 195th value would lie in the class interval 173-179.