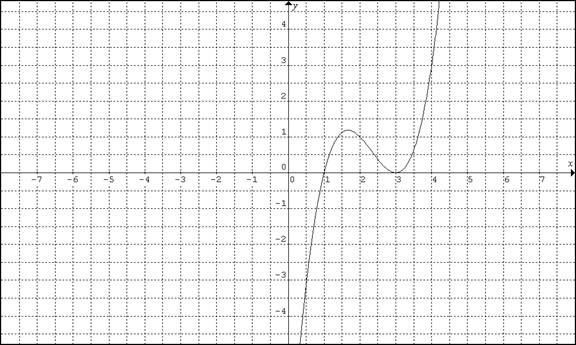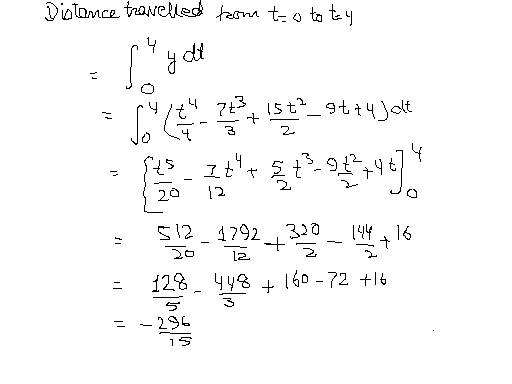
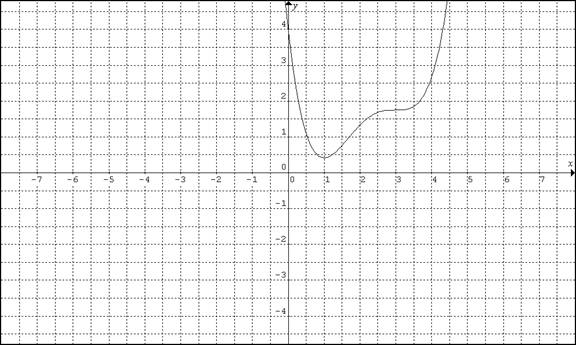
The position time graph is shown below, where displacement y is on the vertical axis and the time t is represented on the horizontal axis. At the point of inflection the concavity is changing. To the left of t=3, the curve is concave down and to the right it is concave up. As can be seen from the graph, y is never negative. It has a minima at t=1. that gives y= ¼ -7/3 +15/2 -9 +4 = 5 /12
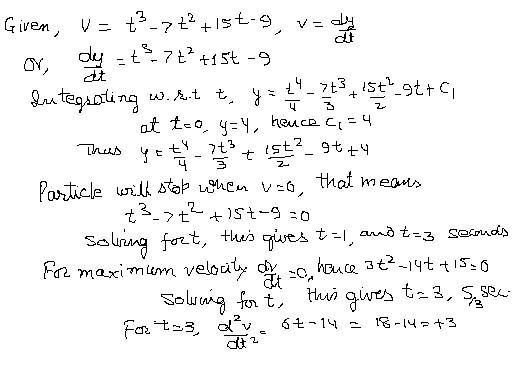
The velocity time graph would be as shown below, where velocity is represented on the vertical axis and time is represented on the horizontal axis.