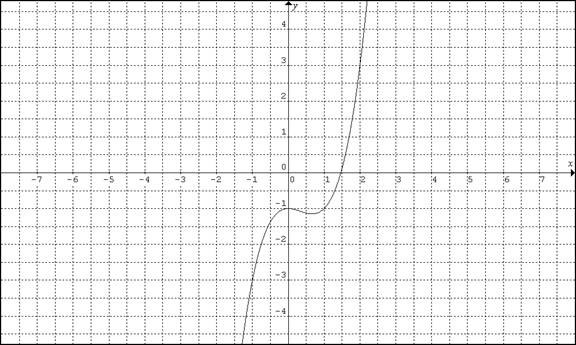
The given inequality is x3-x2 <=1,
Or x3-x2-1 <=0
The graph of the function f(x)= x3-x2-1 is as shown above. The inequality x3-x2-1 <=0 will represent the region to the left of the graph in the third and fourth quadrant.
***
The given inequality is x3-x2 <=1,
Or x3-x2-1 <=0
The graph of the function f(x)= x3-x2-1 is as shown above. The inequality x3-x2-1 <=0 will represent the region to the left of the graph in the third and fourth quadrant.
***