First, you have
to have a clear idea what y = 2x^2+4x-5 means. This is an equation that tells
you that, for any value of x, you can find y by dividing by multiplying x by x,
and then multiplying that by two, adding 4 times x and finally subtracting 5.
Does that sound familiar?
Now, what is
the table you have to make? You will list several values of x (which you will
be using as x-coordinates in your graph), and for
each one use
the equation to find what y is. We'll show the work:
For x = 1, y = 2*1*1 +
4*1 - 5 = 1
For x = 2, y = 2*2*2 +
4*2 - 5 = 11
For x = 3, y = 2*3*3 +
4*3 - 5 = 25
For x = 4, y = 2*4*4 +
4*4 - 5 = 43
For x = 5, y = 2*5*5 +
4*5 - 5 = 65
Do you see what
we did there? We just replaced x in the equation by each value of x, and did
the multiplication and addition.
Now your table
will look like this:
x | y
--+-----
1 | 1
2 | 11
3 | 25
4 | 43
5 | 65
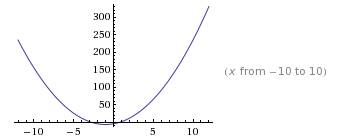
We’ve only
shown the x,y values for 1 through 5, but there are an infinite number of x
values that you could plug in, including negative numbers and fractions. You
can use the resulting T chart to help you create a graph, which will look like
this:
![]()